Clear The Air Ships Air Pollution Blog Rotating Header Image

Vietnam PM Gives Green Light to Ship Pollution Plan

http://shipandbunker.com/news/apac/396489-vietnam-pm-gives-green-light-to-ship-pollution-plan

Vietnam’s ​​​Prime Minister Nguyen Xuan Phuc has approved a national plan aimed at controlling the environmental impacts of shipping through the enhancement of environmental inspections at the country’s ports, as well as an increase in officials and civil servants’ capacities in the state’s maritime management agencies, local media reports.

With the goal of fully implementing regulations outlined in the International Maritime Organization’s (IMO’s) MARPOL Annexes III, IV, V and VI of the L, the plan will see relevant agencies conduct a review, beginning this year 2016 and running until 2020, of legal documents regarding the prevention of pollution linked to shipping, as well as the appropriate management of discharge from maritime activities.

Further, the plan will facilitate regular vessel inspections that align with regulations contained in Annexes III, IV, V and VI – a process that is said to be intended to fulfill the country’s responsibility in relation to ships registered out of Vietnam – and will work to enhance Vietnamese officials’ capacity in dealing with maritime accidents.

The plan also expresses the intention to increase Vietnam’s cooperation with relevant international organisations and other countries within the region, improving information exchange, technical assistance, personnel training, and technology transfer relating to the implementation of the IMO regulations.

Until 2030, a study will be conducted under the plan to examine viable investment mechanisms and policies for waste collection systems to be used at sea ports, as well as effective and regulation compliant equipment to monitor sewage and garbage discharged by ships.

In March, an inauguration ceremony was held for Vietnam’s international seaport at Cam Ranh Bay, marking the completion of its first phase of construction as part of a national push to transform the port into one of the country’s top deep water ports, and a regional hub for maritime service, including bunkering.

Surprise! The Air Near Major Ports Is Bad for Kids

http://www.newsweek.com/surprise-air-near-major-ports-bad-kids-460773

Air pollution is an insidious thing. The particulate matter that streams out of tailpipes and power plants contains an extensive list of contaminants—everything from carcinogens to endocrine-disrupting compounds—in addition to the tiny specks of soot we’ve come to associate with the higher rates of asthma and other respiratory disorders seen in populations that live near major highways or industrial facilities. Basically, every part of it is bad for you, and researchers just found two more toxins to add to the list: nickel and vanadium.

According to as-yet-unpublished research that is being presented Tuesday at the American Thoracic Society’s 2016 international conference, the nickel and vanadium found in the exceptionally fine-grained class of air pollution called PM2.5 damages children’s developing lungs. And in Southern California, where the research was conducted, these toxins mainly appear in the air pollution that comes from shipping vessels.

Because their diameter is so small (2.5 microns, or 1/120th the width of a strand of human hair), PM2.5 particles are known to make their way down into the farthest reaches of the lungs and even slip into the bloodstream. Previous research has shown that when a woman is exposed to PM2.5 in pregnancy, the particles can reach her fetus, whose lungs may grow fewer alveoli, the grape-like clusters in which air is taken and oxygen is separated and diffused to the blood. Her baby, then, may be born with diminished lung capacity, or a greater proclivity toward asthma. (Also, because evidence suggests that lungs continue to develop until we’re about 25 years old, air pollution may work to stunt alveoli development the entire time.)

For this latest research, Robert Urman, a researcher from the University of Southern California, and his co-authors assessed health records from 1,911 elementary school children from various communities in Southern California. Among them, the highest levels of nickel and vanadium in the air were found in Long Beach, California, where cargo chips and other vessels burn fuel oil while leaving and entering the ports of Long Beach and Los Angeles, which combined is the largest seaport in the United States.

“When we analyzed the data, we found that teenaged children in the most polluted communities had an estimated decrease of approximately four percent in their lung function compared to similar children in the least polluted communities,” Urman said in a statement.

A large-scale study last year found that when air pollution is reduced, children’s lung function improves significantly in the surrounding community. “The National Ambient Air Quality Standards currently regulate PM2.5 mass as a whole,” Urman says, but he adds that more research is needed to understand what components of air pollution are particularly bad for children’s lungs, so risk assessments and regulations can be tailored to target them. “If we could establish a link between these components and health-related outcomes, then more targeted regulations could be enacted to better protect the health of the general population.”

Using nanostructured filters to reduce shipping pollution

http://phys.org/news/2016-05-nanostructured-filters-shipping-pollution.html

Cargo ships are among the leading sources of pollution on the planet. Starting in 2020, however, stricter sulfur emission standards will take effect. A low-cost solution for reaching the new targets may come from an EPFL start-up, which is developing a nanostructured filter for use in a ship’s exhaust stacks.

Around 55,000 cargo ships ply the oceans every day, powered by a fuel that is dirtier than diesel. And owing to lax standards, maritime transport has emerged as one of the leading emitters – alongside air transport – of nitrogen oxide and sulfur. But the International Maritime Organization has enacted tighter emission limits, with new standards set to take effect in 2020. In response, an EPFL start-up is developing a low-cost and eco-friendly solution: a filter that can be installed in the ships’ exhaust stacks. The start-up, Daphne Technology, could do well on this massive market.

Lowering sulfur emissions to below 1%

Under laboratory conditions, the nanostructured filter is able to cut sulfur emissions to below 1% and nitrogen oxide emissions to 15% of the current standards. This is a major improvement, seeing as the new standards will require an approximately 14% reduction in sulfur emissions.

Manufacturing the filters is similar to manufacturing solar cells. A thin metal plate – titanium in this case – is nanostructured in order to increase its surface area, and a number of substances are deposited in extremely thin layers. The plates are then placed vertically and evenly spaced, creating channels through which the toxic gases travel. The gases are captured by the nanostructured surfaces. This approach is considered eco-friendly because the substances in the filter are designed to be recycled. And the exhaust gas itself becomes inert and could be used in a variety of products, such as fertilizer.

The main challenges now are to figure out a way to make these filters on large surfaces, and to bring down the cost. It was at EPFL’s Swiss Plasma Center that researcher Mario Michan found a machine that he could modify to meet his needs: it uses plasma to deposit thin layers of substances. The next step is to produce a prototype that can be tested under real-world conditions.

The idea to solve the problem of toxic gas emissions came to the researcher after working on merchant freighters while completing his Masters in microtechnology. It took several years, some techniques he picked up in the various labs in which he worked, and a few patents for Michan to make headway on his project. It was while he was working in another field at CERN and observing the technologies used to coat the inside of particle accelerators that he discovered a process needed for his original concept. An EPFL patent tying together the various aspects of the technology and several manufacturing secrets should be filed this year.

According to the European Environment Agency, merchant ships give off 204 times more sulfur than the billion cars on the roads worldwide. Michan estimates that his nanostructured filters, if they were used by all cargo ships, would reduce these emissions to around twice the level given off by all cars, and the ships would not need to switch to another fuel. Other solutions exist, but his market research showed that they were all lacking in some way: “Marine diesel fuel is cleaner but much more expensive and would drive up fuel costs by 50% according to ship owners. And the other technologies that have been proposed cannot be used on boats or they only cut down on sulfur emissions without addressing the problem of nitrogen oxide.”


Watch cargo ships sail Earth’s oceans: Hypnotic interactive map follows the route of giant vessels over a year

  • Red shows huge tankers, blue represents dry bulk ships, and yellow shows ships carrying manufactured products
  • Different filters can be added to the interactive map to show port names, vessel routes and different ship types
  • Researchers want the map to shed light on how large a carbon footprint is created by the world’s cargo ships

http://www.dailymail.co.uk/sciencetech/article-3562440/Watch-cargo-ships-sail-Earth-s-oceans-Hypnotic-interactive-map-follows-route-giant-vessels-year.html

From the buzz of activity in the East China Sea to the relative quiet of Somalia’s piracy afflicted waters, a new map has revealed the world’s shipping activity in mesmerising detail.

The interactive map provides a fascinating glimpse into hows these shipping vessels navigate through vast oceans as they bring their valuable cargoes to port – but it also serves a more serious purpose.

Researchers want the map to shed light on just how large a carbon footprint is created by the world’s cargo ships. It is estimated that a single large container ship can emit pollutants equivalent to that of 50 million cars.

The issue we were following was the levels of greenhouse gas emissions from cargo ships and their pollution impact,’ Tristan Smith, a reader at University College London’s Energy Institute, told Motherboard.

The data points show the movements of the world’s commercial shipping fleet over the course of 2012. It also shows their fuel consumption every hour.

Shipmap’s website says that ‘billions of tonnes of ships and cargo rely on burning massive quantities of bunker fuel’.

This results in the release of huge amounts of carbon dioxide, which is the main driver of global warming.

Emissions from international shipping for that year were estimated to be 796 million tonnes CO2 which is more than the whole of the UK, Canada or Brazil emit in a year.

That’s 2.18 million tonnes CO2 per day or 90,868 tonnes CO2 per hour.

To create the map, researchers at UCL Energy Institute and Kiln estimated emissions from five different ship types and plotted 250 million data points.

The data is based on hundreds of millions of individually recorded ship positions; plotting all of these at once shows the extraordinary extent of modern shipping’s reach

From the buzz of activity in the East China Sea to the relative quiet of Somalia's piracy afflicted waters, a new map has revealed the world's shipping activity. Pictured are the shipping routes for various cargo ships around the world in 2012. Red represents huge tankers, blue shows dry bulk ships, yellow show ships that carry manufactured products,  Green gas bulk and purple shows ships carrying vehicles

From the buzz of activity in the East China Sea to the relative quiet of Somalia’s piracy afflicted waters, a new map has revealed the world’s shipping activity. Pictured are the shipping routes for various cargo ships around the world in 2012. Red represents huge tankers, blue shows dry bulk ships, yellow show ships that carry manufactured products, Green gas bulk and purple shows ships carrying vehicles

It was pulled from exactEarth, a company that provides location-based information on maritime traffic, and the Clarksons Research UK World Fleet Register, which registers the world’s fleet

Based only on ship movements and without a background map, the world’s coastlines are clearly defined, with plenty of variation in ship activity, including in areas you might not expect them, such as the Arctic and Antarctic.

The map clearly shows the most crucial shipping thoroughfares of all: the canals linking different bodies of water, such as the Panama Canal, which opened a century ago to connect the Atlantic and Pacific Ocean.

It also shows the even older and busier Suez Canal which saw 17,000 transits in 2012 alone.

To observe the flows of the global economy in more detail, users can distinguish between five different ship types.

The red dots represent huge tankers, the blue dots show dry bulk ships that move cargo like ores, and the yellow dots show ships that carry manufactured products.
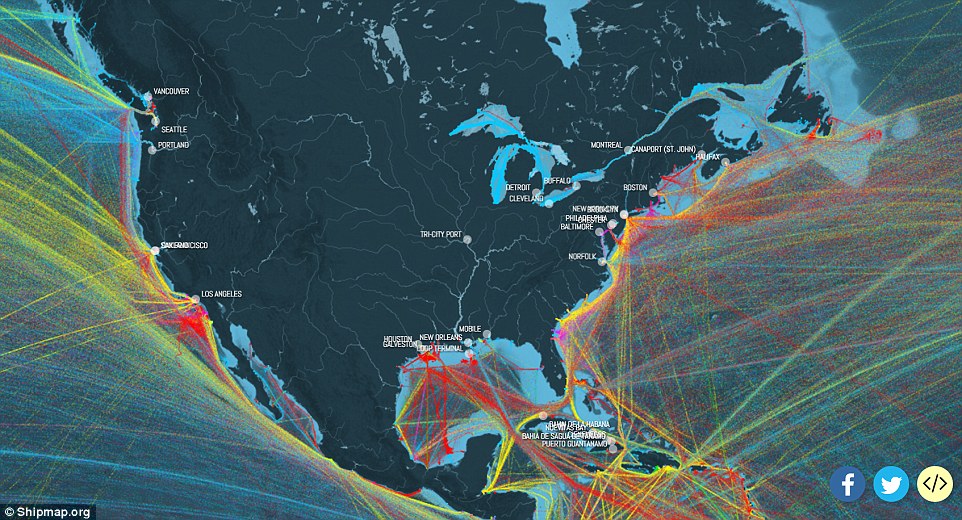
The interactive map provides a fascinating glimpse into hows these shipping vessels navigate through vast oceans as they bring their valuable cargoes to port. The shipping routes around the US are shown here. New Orleans, Houston and Large Angeles appear to be the hub for huge tankers

The interactive map provides a fascinating glimpse into hows these shipping vessels navigate through vast oceans as they bring their valuable cargoes to port. The shipping routes around the US are shown here. New Orleans, Houston and Large Angeles appear to be the hub for huge tankers

The dots represent the cargo vessels approximate locations around the world on 23 February 2012. Shipmap's website says that 'billions of tonnes of ships and cargo rely on burning massive quantities of bunker fuel'. This results in the release of huge amounts of carbon dioxide, which is the main driver of global warming
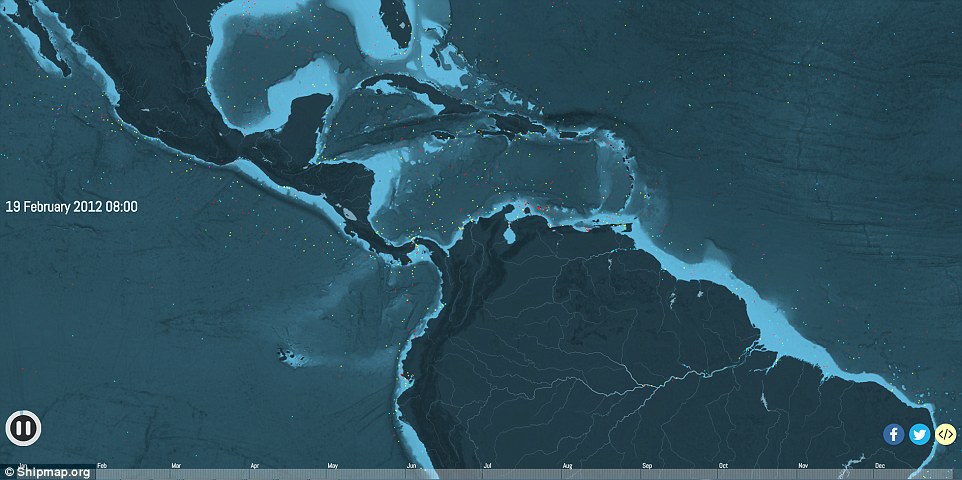
The dots represent the cargo vessels approximate locations around the world on 23 February 2012. Shipmap’s website says that ‘billions of tonnes of ships and cargo rely on burning massive quantities of bunker fuel’. This results in the release of huge amounts of carbon dioxide, which is the main driver of global warming

The map clearly shows the most crucial shipping thoroughfares of all: the canals linking different bodies of water, such as the Panama Canal, which opened a century ago to connect the Atlantic and Pacific Ocean

The map clearly shows the most crucial shipping thoroughfares of all: the canals linking different bodies of water, such as the Panama Canal, which opened a century ago to connect the Atlantic and Pacific Ocean

Green shows gas bulk and purple shows ships carrying vehicles.

It clearly shows the movements of tankers which ship oil from massive terminals in the Middle East or from offshore rigs in West Africa and elsewhere.

It also shows dry bulk carriers moving aggregates, ores and coal from mines and quarries, many of which are found in Australia and Latin America.

Many of these raw materials are shipped to manufacturing regions to make finished goods which are themselves moved back across the ocean in container ships.

UCL-Energy researchers estimated that the map shows roughly 50,000 cargo ships, some of which are over quarter of a mile long.

The next step, they say, is to update their map based on newer data.
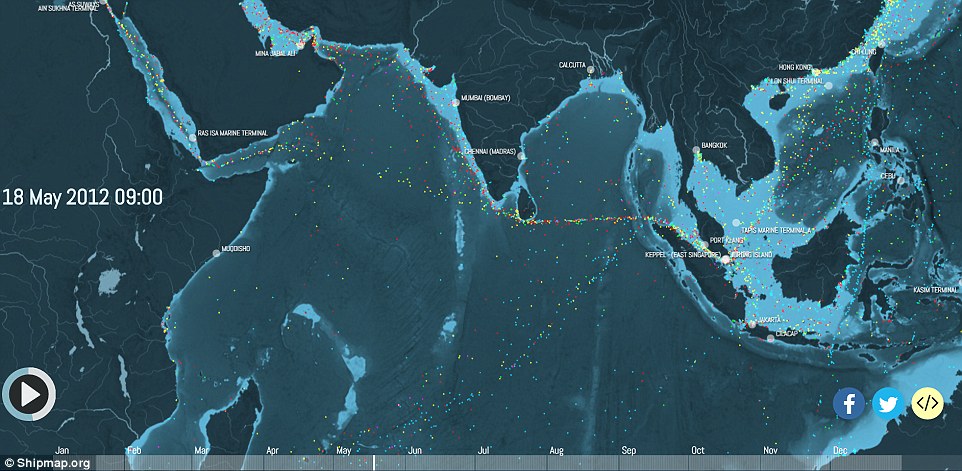
To create the map, researchers at UCL Energy Institute estimated emissions from five different ship types and plotted 250 million data points. The data is based on hundreds of millions of individually recorded ship positions; plotting all of these at once shows the extraordinary extent of modern shipping's reach. Shown here is shipping movement across the Indian ocean

To create the map, researchers at UCL Energy Institute estimated emissions from five different ship types and plotted 250 million data points. The data is based on hundreds of millions of individually recorded ship positions; plotting all of these at once shows the extraordinary extent of modern shipping’s reach. Shown here is shipping movement across the Indian ocean
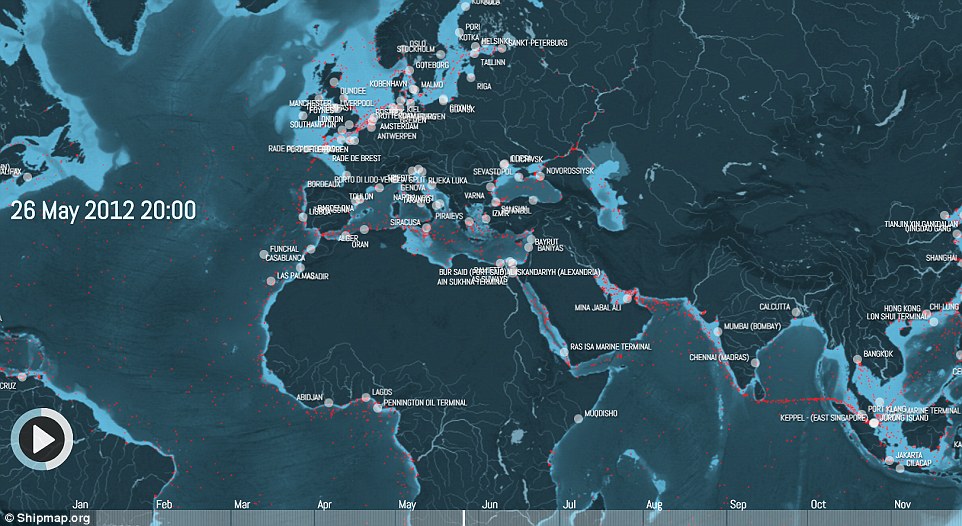
Shown here are the major European pots with the red dots representing huge tankers. The map clearly shows the movements of tankers which ship oil from massive terminals in the Middle East or from offshore rigs in West Africa and elsewhere.

Shown here are the major European pots with the red dots representing huge tankers. The map clearly shows the movements of tankers which ship oil from massive terminals in the Middle East or from offshore rigs in West Africa and elsewhere.

Big benefits of cleaner marine fuel

Air quality in coastal areas improved significantly in 2015 after stricter sulphur limits for marine fuels were introduced in the North Sea and the Baltic Sea.

In several countries bordering the North Sea and the Baltic Sea, concentrations of sulphur dioxide (SO₂) have come down by 50 per cent or more in 2015 compared to previous years, according to a recent study by the Dutch research consultancy CE Delft conducted on behalf of the German environmental group NABU (Nature and
Biodiversity Conservation Union).

The study has investigated the experiences of the first year of applying stricter marine fuel sulphur standards in the Sulphur Emission Control Area (SECA) covering the North Sea and the Baltic Sea. It focussed on air quality, socio-economic effects, impacts on business, and on compliance and enforcement.

As from 1 January 2015 the maximum sulphur content of marine fuels used in SECAs was reduced by 90 per cent, from 1.0 to 0.1 per cent. The resulting health benefits of better air quality were estimated to amount to between €4.4 and 8 billion.

This can be compared to the cost to the maritime sector of moving to low-sulphur marine gas oil (MGO) in the North Sea and the Baltic Sea, which was estimated at €2.3 billion.

The researchers conclude that the health benefits of lower emissions of SO₂ and particulate matter (PM) were between 1.9 and 3.5 times higher than the increase in fuel costs, which means that the benefits of introducing the new regulations clearly outweighed the cost.

Before its implementation, there were industry concerns that the stricter fuel standard would significantly increase fuel costs and that there would be problems with the availability of low sulphur fuels. There were also concerns about impacts on the industry, such as closures of companies or services, and potential shifts towards road transport. The lack of effective surveillance schemes to ensure compliance and enforcement were also subject to debate.

The study found that the availability of MGO has proven to be sufficient and that the price of MGO actually decreased – the latter mainly as the result of reduced oil prices in general. However, the MGO price decreased more sharply than the price of heavy fuel oil (HFO) and automotive diesel. In fact, by the end of 2015, the price of 0.1 per cent sulphur MGO was at the same level as the price of high-sulphur HFO was at in the beginning of 2015.

No significant shifts towards road transport were found for RoRo transport, which is regarded as the market segment that is most sensitive to a modal shift.

Moreover, no company or service closures, nor any decrease in cargo turnover in Northern European ports, was found that could be clearly linked to the introduction of the stricter sulphur standard.

Interestingly, some shipping companies reported a financial record year for the year 2015 and established new services.

According to data for 2015 from the European Maritime Safety Agency (EMSA), between three and nine per cent of the ships were non-compliant in the Baltic Sea and North Sea, respectively. It should be noted that countries typically use a margin of up to 20 per cent above the legal threshold during control in ports for reporting deficiencies and 50 per cent for applying sanctions.

It is believed that the rate of noncompliance on the open seas might be significantly higher, but the limited data available does not allow any firm conclusions.

More and better data are needed in order to estimate the actual compliance rate on the open seas. In addition, fuel sampling needs to be intensified in 2016 in order to meet the required 30–40 fuel samples per 100 administrative inspections, as required by EU legislation.

It is recommended that there should be further development of monitoring and control techniques, including control on the open seas, to improve the effectiveness of the inspection regime. The authors also recommend that countries apply sanctions that are proportionate to the economic benefits of non-compliance.

Christer Ågren

Sources: CE Delft press release and Ends Europe Daily, 20 April 2016

The study: “SECA Assessment: Impacts of 2015 SECA marine fuel sulphur limits” (April 2016).

By CE Delft, the Netherlands. Downloadable at: http://www.cedelft.eu/publicatie/seca_assessment%3A_impacts_of_2015_seca_marine_fuel_sulphur_limits/1780

A Model For Greener Cruising?

http://cdn-contentviewer.adobe.com/v/e90145fb-90a7-4d05-a3aa-a966925e7f56/ecoship/3/StackResources/asset_L_1.png

asset_L_1

dps_asset_pdf_1_1

Steadily declining volume drops Hong Kong down global rankings

Hong Kong slid to fifth place in the global port rankings after another dismal year of declining volumes, with the east Chinese port of Ningbo-Zhoushan stepping into fourth spot.

The port of Hong Kong has now seen throughput volumes falling for 18 consecutive months, according to preliminary figures from the Hong Kong Port Development Council.

You need to go back as far as June of 2014 to find a positive throughput growth figure for Hong Kong. In the eighteen months since then, the port has seen an average monthly throughput decline of 7.4 percent. The highest monthly decline of 18.8 percent was recorded in October of last year.

Port Development Council figures show Hong Kong handled 20.1 million 20-foot-equivalent units in 2015, a drop of 9.5 percent over the previous year, while Ningbo-Zhoushan recorded a throughput of 20.6 million TEUs.

Preliminary figures show Shanghai was the busiest container port in the world last year, handling 36.5 million TEUs, followed by Singapore (30.9 million), Shenzhen (24.2 million), Ningbo-Zhoushan (20.6 million) and Hong Kong (20.1 million).

Singapore also had a miserable 2015, with full year throughput volumes falling 8.7 percent. The Maritime and Port Authority of Singapore (MPA) blamed the decline on weak Asia-Europe volumes, the rebalancing of volumes across alliance agreements, and an increase in direct sailings due to low bunker prices.

To increase competitiveness the MPA has reduced the fees it charges container lines by 10 percent, while terminal operator PSA said it is working with customers to help them lower operational costs by enhancing productivity.

The South Korean port of Busan, the sixth-busiest container port worldwide last year, handled 19.45 million TEUs, representing growth of 4 percent. The port managed to expand its transshipment business to 10.8 million TEUs, 52 percent of total volumes, and stated its ambition to overtake Hong Kong as the world’s second-busiest container transshipment hub.

Busan took measures last year to simplify the business environment for foreign shipping lines, including issuing bills for port charges in English as well as Korean, which eliminates the need for foreign lines to use agencies to translate details of the charges. According to an announcement by South Korea’s Ministry of Oceans and Fisheries, fees for ships entering, departing and cargo handling at Busan will not be increased this year and will be reduced by 70 percent by 2019.

Ningbo-Zhoushan is also targeting transshipment business as a strategy to insulate itself from the effects of a slowing domestic economy. The port opened a transshipment operations center last year and stepped up development and coordination with major carriers, leading its transshipment traffic to increase by 22 percent to more than 4 million year-over-year from January to November last year.

Terminal operators in Hong Kong are pressing the government for assistance to improve competitiveness. A major issue they face is a rule that prevents mainland truck drivers from driving over the border into Hong Kong, which means when trucks reach the border, the driver has to switch to one holding Hong Kong residency.

The lack of back-up land in the container yards is another major issue. The government released a proposal to integrate 15 hectares (37 acres) of adjacent back-up real estate to build out new yard space and barge berthing facilities, but terminal operators say it is a case of too little, too late.

Hong Kong’s decline as a container shipment hub could be exacerbated if a proposed relaxation in cabotage laws in mainland China comes to fruition. Protection of Hong Kong’s role as a transshipment hub is believed to be one of the primary reasons for continuing restrictions on cabotage in the mainland. With cabotage protections in place, Hong Kong remains attractive for handling mainland China-related transshipment cargo, which in turn sustains its competitiveness in handling transshipment cargo for other trade routes.

Air pollution from ships

Download (PDF, 601KB)

Bracing seaside air could carry deadly pollution from ships

Download (PDF, 1.99MB)

Transforming the oil recycling industry: Hong Kong shipping magnate’s innovation to reduce air pollution

A Hong Kong shipping magnate is making a foray into the mainland market for greener recycled engine oils following nearly a decade of refining research in the city.

Fenwick Shipping boss Antony Marden said demand was growing on the mainland for high-quality base oils that were not just “strained through a sock”, de-watered, burned and sold off as heavily polluting and illegal low-grade diesel.

“About 70 to 80 per cent of lube oil is collected in China because it is too valuable to be thrown down the drain,” said Marden, whose company CleanOil Investment opens its first re-refining plant in Zhuhai’s Gaolan petrochemicals zone today.

“But what happens to it is that most of it is re-refined in the most basic way, which has a low-rate of recovery and creates high secondary pollution as it is most always just burned, polluting the air.”

The company’s patented closed-loop technology will be able to reap a 90 per cent recovery rate from the feedstock, which is about a third higher than the industry standard. It will do so virtually free of any waste emissions.

A four-stage process extracts a large amounts of impurities from the feedstock by filtering and vacuum flashing before the residual substances or spent additives left behind are extracted. The final product is a stable “group II” base, free of hazardous chemicals and gases, which can be re-refined indefinitely.

About 90 per cent of the company’s products will be sold to blenders and refiners on the mainland, while the rest will be marketed and sold under the brand CleanOil. It will not be sold in Hong Kong.

The company is not a first mover – major mainland oil firms are producing similar products – but Marden claims that this area is still a “blind spot” among his competitors, especially in southern provinces.

Marden, who partnered with Jebsen Industrial two and a half years ago to build the US$40 million state-of-the-art Zhuhai plant, said he aimed to roll out another four or five bigger plants in about six months to a year.

The company had been running a plant in Hong Kong’s Yuen Long area for about 10 years before it had “served its purpose” as an R&D centre and demolished two years ago.

Marden admitted that it had taken longer than expected to set up the venture but it had been a market he had been eyeing for a while as the mainland automobile market continued to grow.

“I’m a shipowner and it’s a cyclical business,” Marden said. “I thought I would try something different…I believe anything good for the environment and you can make money with, has got to be a win-win situation.”

Source URL: http://www.scmp.com/news/hong-kong/health-environment/article/1875410/green-and-profitable-hong-kong-shipping-magnate